In the context of econometrics and the empirical analysis in
microeconomics, we focus on the type I error and pay much attention on
p-value evaluated at a given significance level (
When evaluating the results from a A/B testing and comparing the performances of alternative machine learning models, we inevitably encounter quite a few measures pertaining to type I and type II errors. In this post, I am going to review the error types and some relevant measures.
Error Types
Errors arise in the process of the statistical testing. Let
| Reject |
Type I error False Positive (FP) |
Correct True Positive (TP) |
| Cannot reject |
Correct True Negative (TN) |
Type II error False Negative (FN) |
As follows, there are relevant measures build on this table:
Recall, Sensitivity, or True Positive Rate (TPR):
where represents the statistical power of the test. False Positive Rate (FPR):
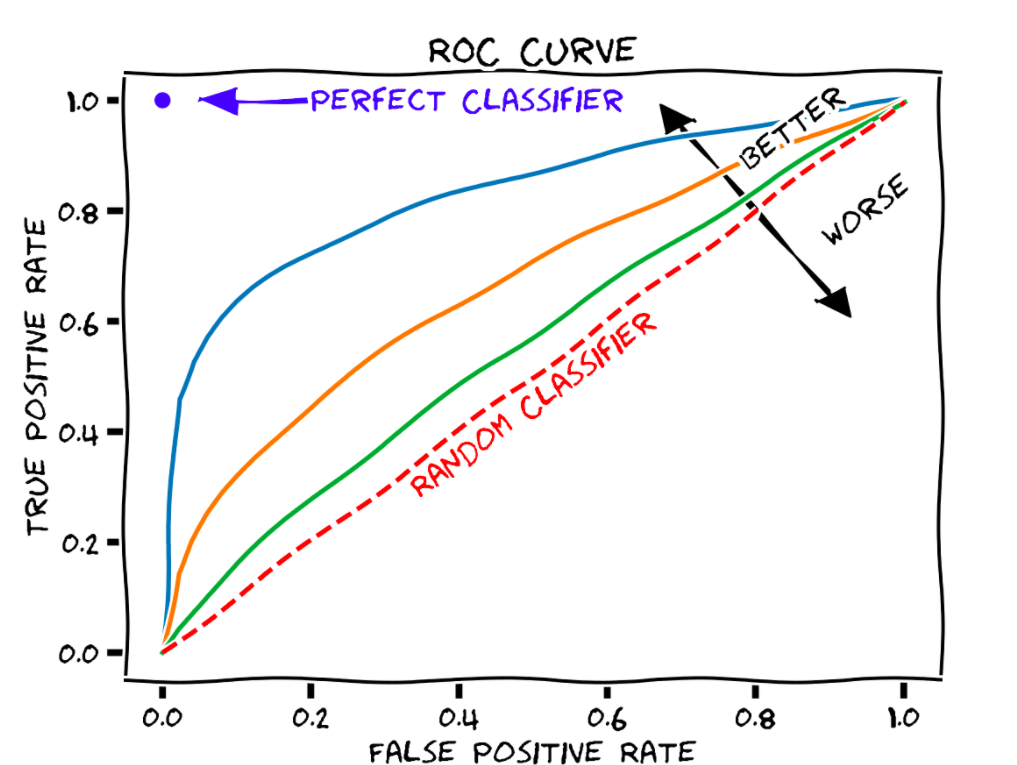
where represents the significance level of the test. > In a binary classification problem, the TPR and the FPR will vary accordingly as we change the determination threshold in a model (e.g., the cut-off point for a logit model in predicting the credit default). > >  >
> A receiver (or relative) operating characteristic
curve, or ROC curve, is a graphical
plot that illustrates the diagnostic ability of a binary
classifier system as its discrimination threshold is varied.
The method was originally developed for operators of military radar
receivers, which is why it is so named. > > The optimal cut-off
point on ROC can be determined by one of the three criteria (Reference
Link): > > + The farthest point from the random classifier,
that is, max(TPR+FPR), the Youden index > + The closest point to the
perfect classifier (0, 1) > + The point minimizing the cost.
>
> A receiver (or relative) operating characteristic
curve, or ROC curve, is a graphical
plot that illustrates the diagnostic ability of a binary
classifier system as its discrimination threshold is varied.
The method was originally developed for operators of military radar
receivers, which is why it is so named. > > The optimal cut-off
point on ROC can be determined by one of the three criteria (Reference
Link): > > + The farthest point from the random classifier,
that is, max(TPR+FPR), the Youden index > + The closest point to the
perfect classifier (0, 1) > + The point minimizing the cost.Precision, or Positive Predictive Value (PPV):
Specificity, Selectivity, or True Negative Rate (TNR):
Accuracy:
F1 Score (Harmonic mean of precision and recall):
> The harmonic mean is best used for fractions such as rates. > > For example, Joe drives a car at 10 mph for the half of the journey and 40 mph for the second half. What’s his average speed? The naïve answer is to calculate the total mileage of the journey and then divide it by the total drive time. Denote the total mileage of the journey as and the total drive time is . Therefore, the average speed is mph.
Trade-off between Errors
We cannot reduce the type I error (false positive) and the type II
error (false negative) at the same time, once a testing environment is
fixed and the observed results are given. Usually, we set the expected
result as the alternative hypothesis
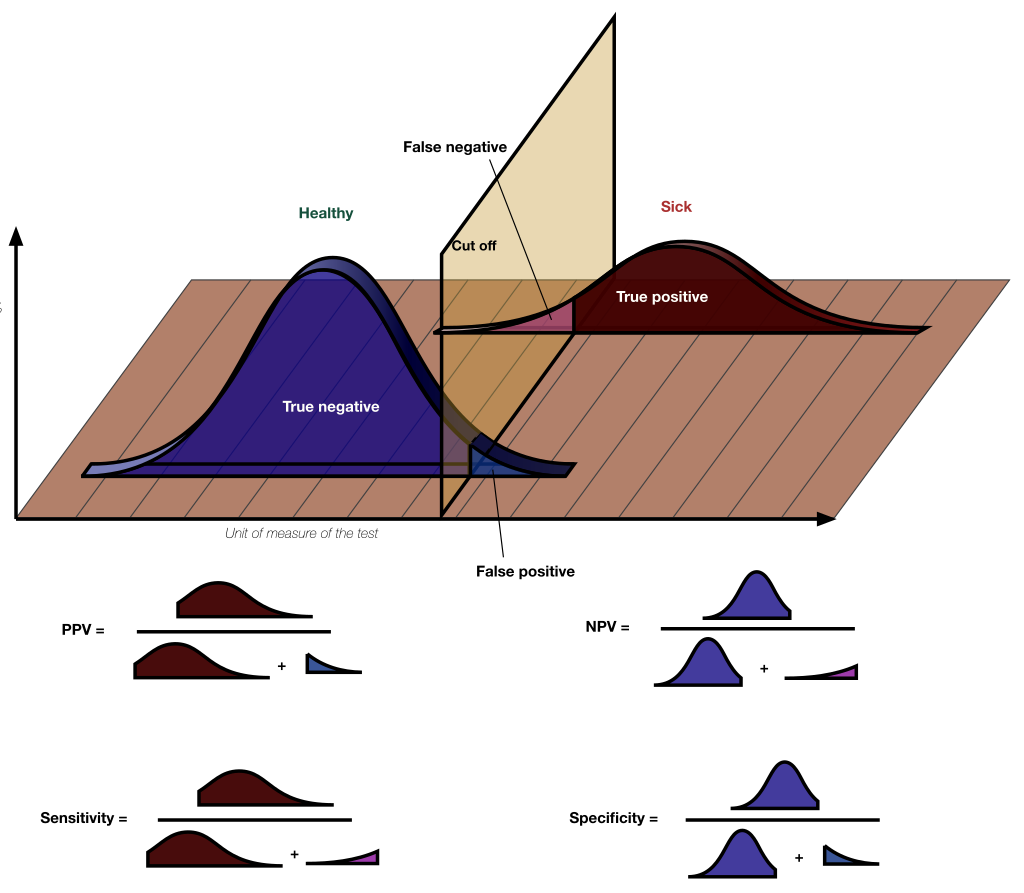
The figure below presents the change in

In this figure, it is easy to see the specificity (
View / Make Comments