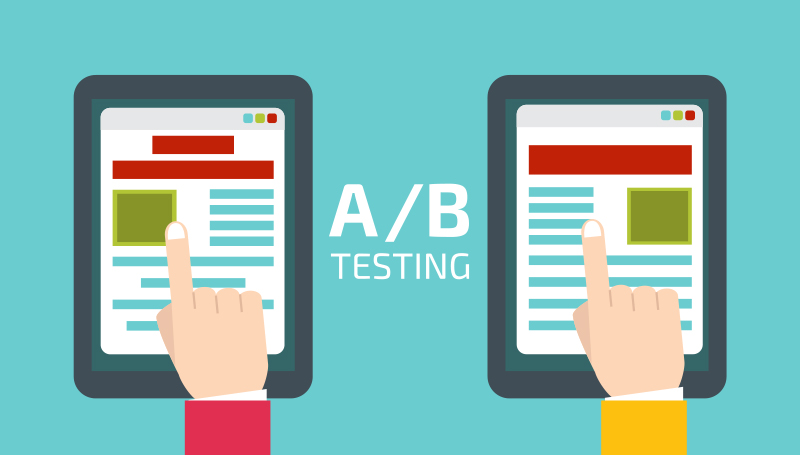
Short Notes on A/B Testing
Motivation
- Understand what drives your business and provide insights for
business decisions
- Understand causal relationship
Prerequisites
- The control and testing groups can be clearly defined
- Metrics of interest can be quantified
- Data can be collected in a timely manner
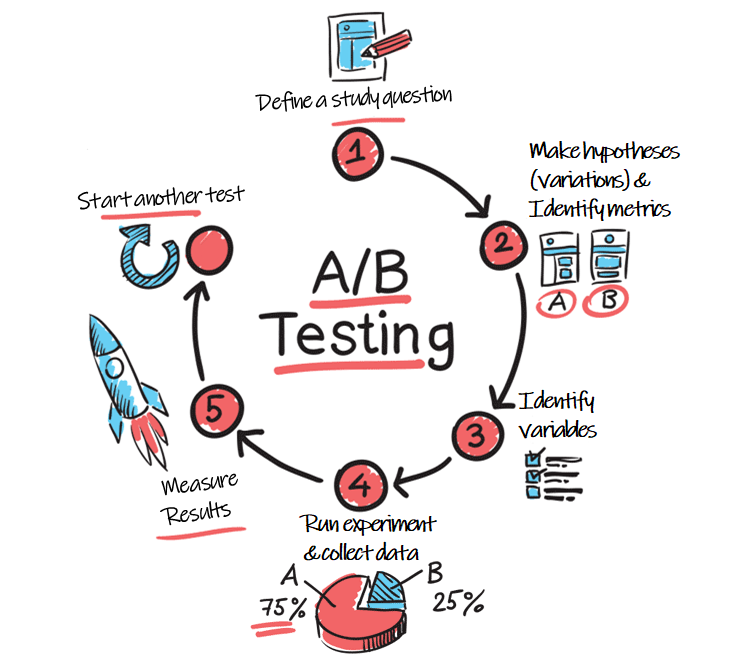
Five Stages in Practice
- Define a study question
- Make hypotheses (variations) and identify metrics
- Identify variables
- Determine the data to be collected
- Run experiments and collect data
- Determine a detectable difference (i.e., how small of a difference you would like to detect, for example, 10% increase in your metric of interest)
- Calculate the proper sample size using power analysis
- Determine what fraction of traffic can be used in the treatment
- Conduct a prior A/A test to check unfavorable impacts on business and a simultaneous A/A test to track seasonality and systematic biases/trend if any
- Measure results

Some Details in A/B Testing
Common Web Analytics Metrics
| Count | Conversion | Time | Business |
|---|---|---|---|
| Page View Visits / Return Visits Click Visitor / Unique Visitor (Daily / Monthly) Active Users |
Click Thru Rate Click Thru Probability User Click Probability Bounce Rate |
Active Time Page View Duration |
Revenue Member Order |
In addition, we can also consider a composite metric.
Examples of Changes for Testing
- Page Contents
- Headlines, Sub Headlines, Font Size
- Background Image, Background Color
- Paragraph Text
- Page Layout
- Call-to-Action
- Button Place, Button Color, Button Size
- Text
Notes: Only one thing can be changed in a pair of the control and treatment group.
Experiment Settings
Target Audience
- Country, Region
- Demographics
Sample Size
Experiment Period (Time)
Percentage of Traffic for A/B Testing
Split for Control and Treatment
Notes: Users visiting the page at different time or using different devices might see different features in the test. These are users in the mixed group, neither in A or B. To solve this problem, we might need to evenly split users in the control and treatment group. Theoretically, the percentages of the mixed group users in A and B should be similar.
A/A Test
Run a small A/A test in a short time prior to the A/B test to check the change in metrics of interest and whether there are any unfavorable impacts on business
Run an A/A test simultaneously to track the systematic trend during the A/B test period
Power Analysis
- False Positive (Type I Error): Falsely reject the
null hypothesis
- False positive rate (
, e.g., 5%) is the significant level of a statistic test
- False positive rate (
- False Negative (Type II Error): Fail to reject
(i.e., we should reject but we did not)
- False negative rate (
, e.g., 20%) is used in calculating the power of a test, i.e.,
- False negative rate (
Discuss the values of
1 | # Here is a function in R |
Result Evaluation
| Group | Control - A | Variation - B |
|---|---|---|
| Unique Visitor | 500 | 500 |
| Unique Click | 50 | 60 |
| Conversion Rate | 10% | 12% |
- Calculate 95% confidence interval (
) - Cannot reject
- Suppose
and become 10 times larger - Reject
Some Challenges in A/B Testing
Tradeoff between
By definition,
is the false positive rate, representing the chance that we falsely reject . In contrast, is the false negative rate, representing the chance that we should reject but didn't. Since resources and time are limited, we need put the effect on the project that improves the business most significantly and has the largest favorable business impact.
As a result, we might emphasize
at expense of . Also, remember to reach an agreement with business before the test.
Insignificant Treatment Effect
- It is worth noting that the difference between control and treatment is insignificant in statistics. The testing feature can be helpful in the long run.
- Generate a line plot to visualize the difference and check if one is above the other in most of the time, though the difference could be statistically insignificant. Such a line plot can also provide some insights.
Multi-armed Bandit Approach
We want to achieve two goals at a time: (1) find the best variant in a longer time of experiment and (2) maximize the revenue during the experiment period as well.
- Solution: Adjust fraction of (new) users in treatment/control according to which group seems to be doing better.
View / Make Comments